


BTCUSDT Long: Rebound Setup Forms Near Key 73,000 Support Area

-
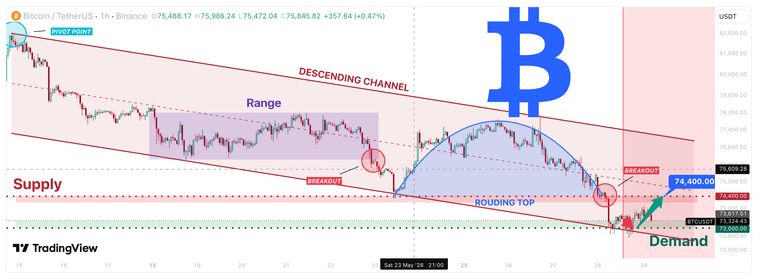
Hello traders! Here’s my technical outlook based on the current BTCUSDT (1H) chart structure. BTCUSDT previously traded inside a descending channel after rejecting from the major pivot high. Following a prolonged consolidation range, price formed a rounding top pattern and later broke below the range support, confirming renewed bearish momentum.
Currently, BTCUSDT is trading above the 73,000 demand zone while remaining below the 74,400 supply zone, which acts as the key resistance area. Price is now attempting to stabilize near the lower boundary of the descending channel.
As long as BTCUSDT remains above the 73,000 demand zone and holds the channel support area, the bullish recovery scenario remains valid. A rebound from the current demand zone could push price toward the 74,400 supply zone (TP1), where sellers may attempt another rejection. Manage your risk!
-
however, as long as the 73,000 area continues holding, the possibility of a relief rally toward the 74,400 supply zone remains valid
-
Every chart looks obvious after it moves

-
Support and resistance: crypto's favorite guessing game.
-
One breakout away from a completely different narrative.
-
Bitcoin loves testing everyone's conviction.
-
The chart says one thing, the market does another.
-
Every support level eventually meets its destiny

-
The more lines on the chart, the stronger the confidence.
-
Bitcoin seeing support: let me check that again

-
One candle can invalidate an hour of analysis.
-
Traders watching the same chart and reaching opposite conclusions.
-
Zoom out and suddenly everything looks less dramatic


-
Feel some pain even I bought lower

