


BNB Price Holds Key Support as Downtrend Pressure Builds
Airdrop and Ways to earn money
2
Posts
2
Posters
3
Views
-
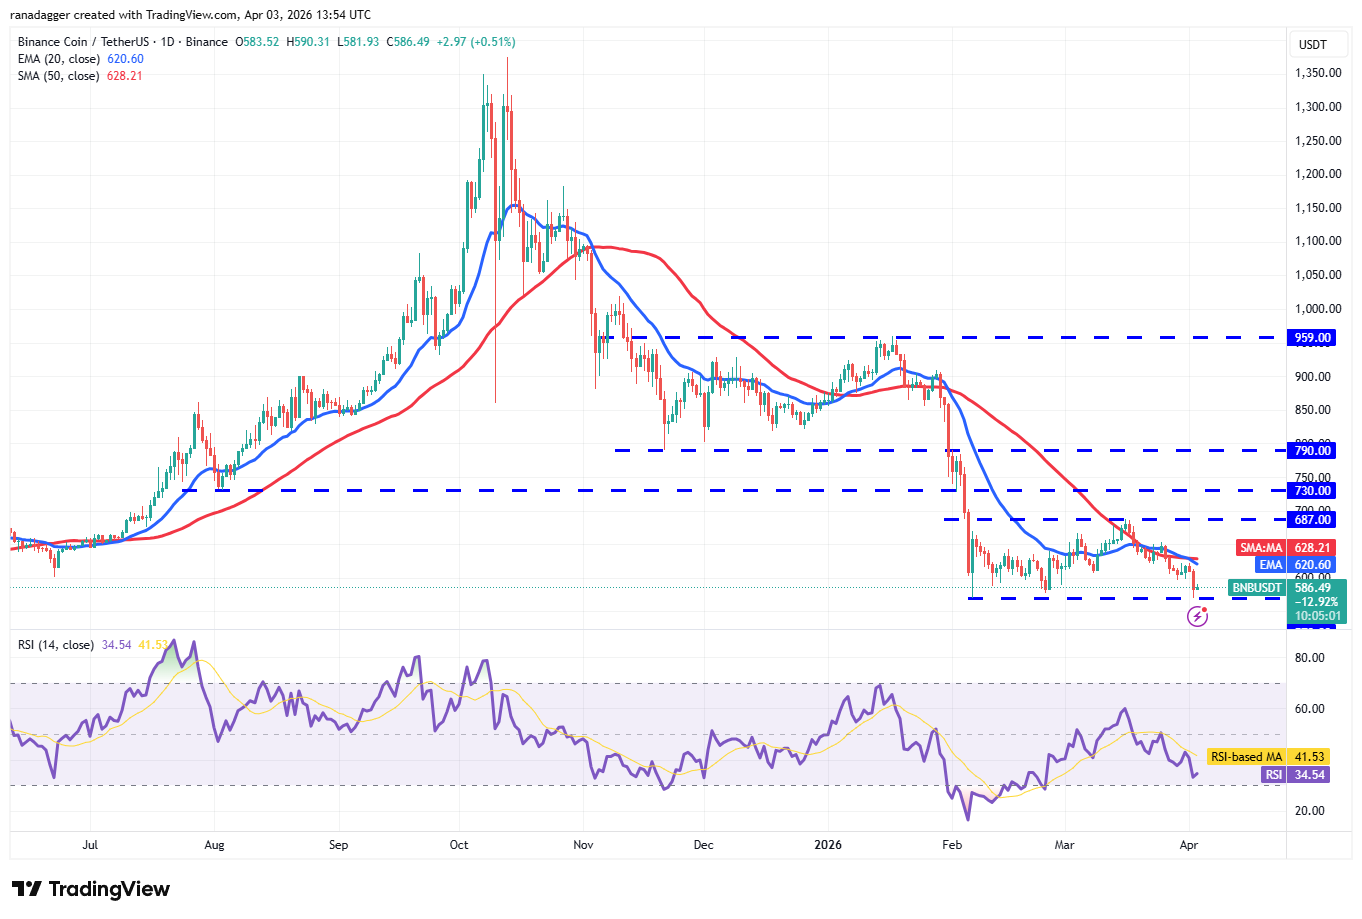
BNB/USDT daily chart. Source: Cointelegraph/TradingViewBNB declined toward the $570 support level after facing rejection near its moving averages, with the 20-day EMA trending downward around $620. Momentum indicators such as the RSI remain close to oversold territory, suggesting continued bearish pressure in the short term.
A confirmed breakdown below $570 could accelerate the decline toward the $500 level, extending the current downtrend. On the upside, a recovery above the moving averages would shift the structure, potentially keeping price action range-bound between $570 and $687 in the near term.