



















 Earn up to 50% APR
 Boost earnings with NFTs
 Play, HODL & earn more







BNB price prediction
-
BNB (BNB) is attempting to find support at the 50-day SMA ($629), indicating a lack of aggressive selling at lower levels.
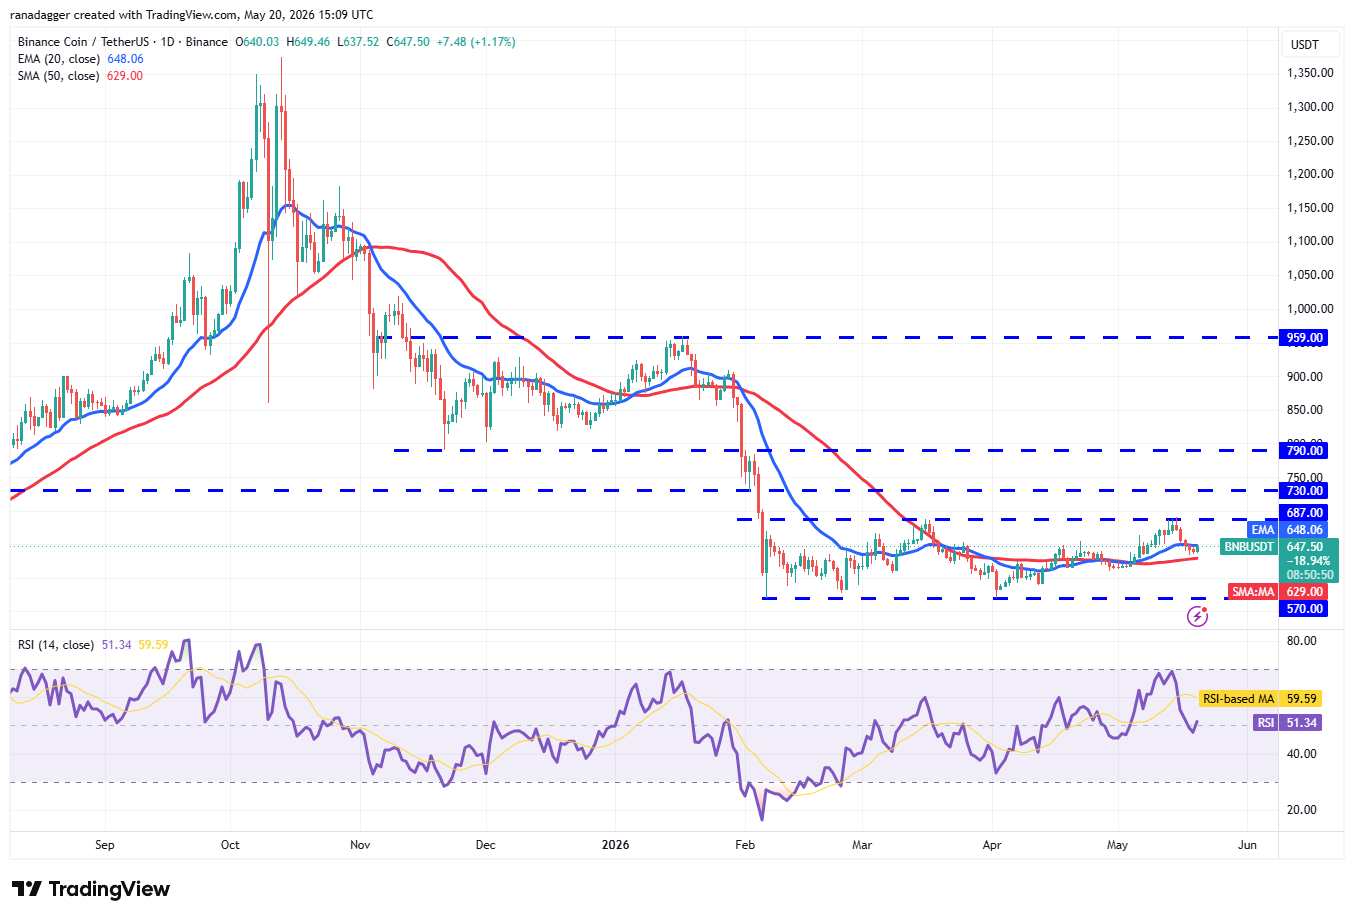
BNB/USDT daily chart. Source: Cointelegraph/TradingView
If the price closes above the 20-day EMA ($648), the bulls will again strive to push the BNB/USDT pair to the $687 resistance. Sellers are expected to aggressively defend the level, as a close above it may push the BNB price to $730 and, after that, to $790. That indicates the pair may have bottomed out in the short term.
Instead, if the price turns down and breaks below the 50-day SMA, it suggests the pair may remain within the $570 to $687 range for some time.
-
BNB is holding up really well

-
Key Takeaway: BNB/USDT is currently testing overhead dynamic resistance, seeking a trigger for either a short-term bottom or prolonged consolidation.
Bullish Scenario: A daily close above the 20-day EMA ($648) opens the path to $687. Breaking past $687 confirms a short-term local bottom, targeting sequential moves toward $730 and $790.
Bearish/Range Scenario: A rejection and breakdown below the 50-day SMA invalidates immediate upside momentum, locking the pair inside a $570–$687 trading range.
-
Current Status: BNB has already played out the bullish scenario shown in the screenshot. It held the $629 support, broke through the $648/687 resistance levels, and is currently trading around $695–$705.
Key Levels Now:
Support: $687–$700 (the old resistance is now new support).
Resistance: $730–$790 (the next major target zone).